Shubenacadie Watershed Protection Society
Blue-Green Algae and Water Quality Data Analysis Report
Megan Elliott
August 26, 2022
Edited SWEPS May’23
Introduction to SWEPS BGA Monitoring
The goal of the SWEPS Blue Green Algae (BGA) project is to identify the sources of the pollutants that contribute to the growth of cyanobacteria blooms. The object of our testing program is to identify high risk areas in the watershed and hopefully be able to predict when the blooms are imminent.
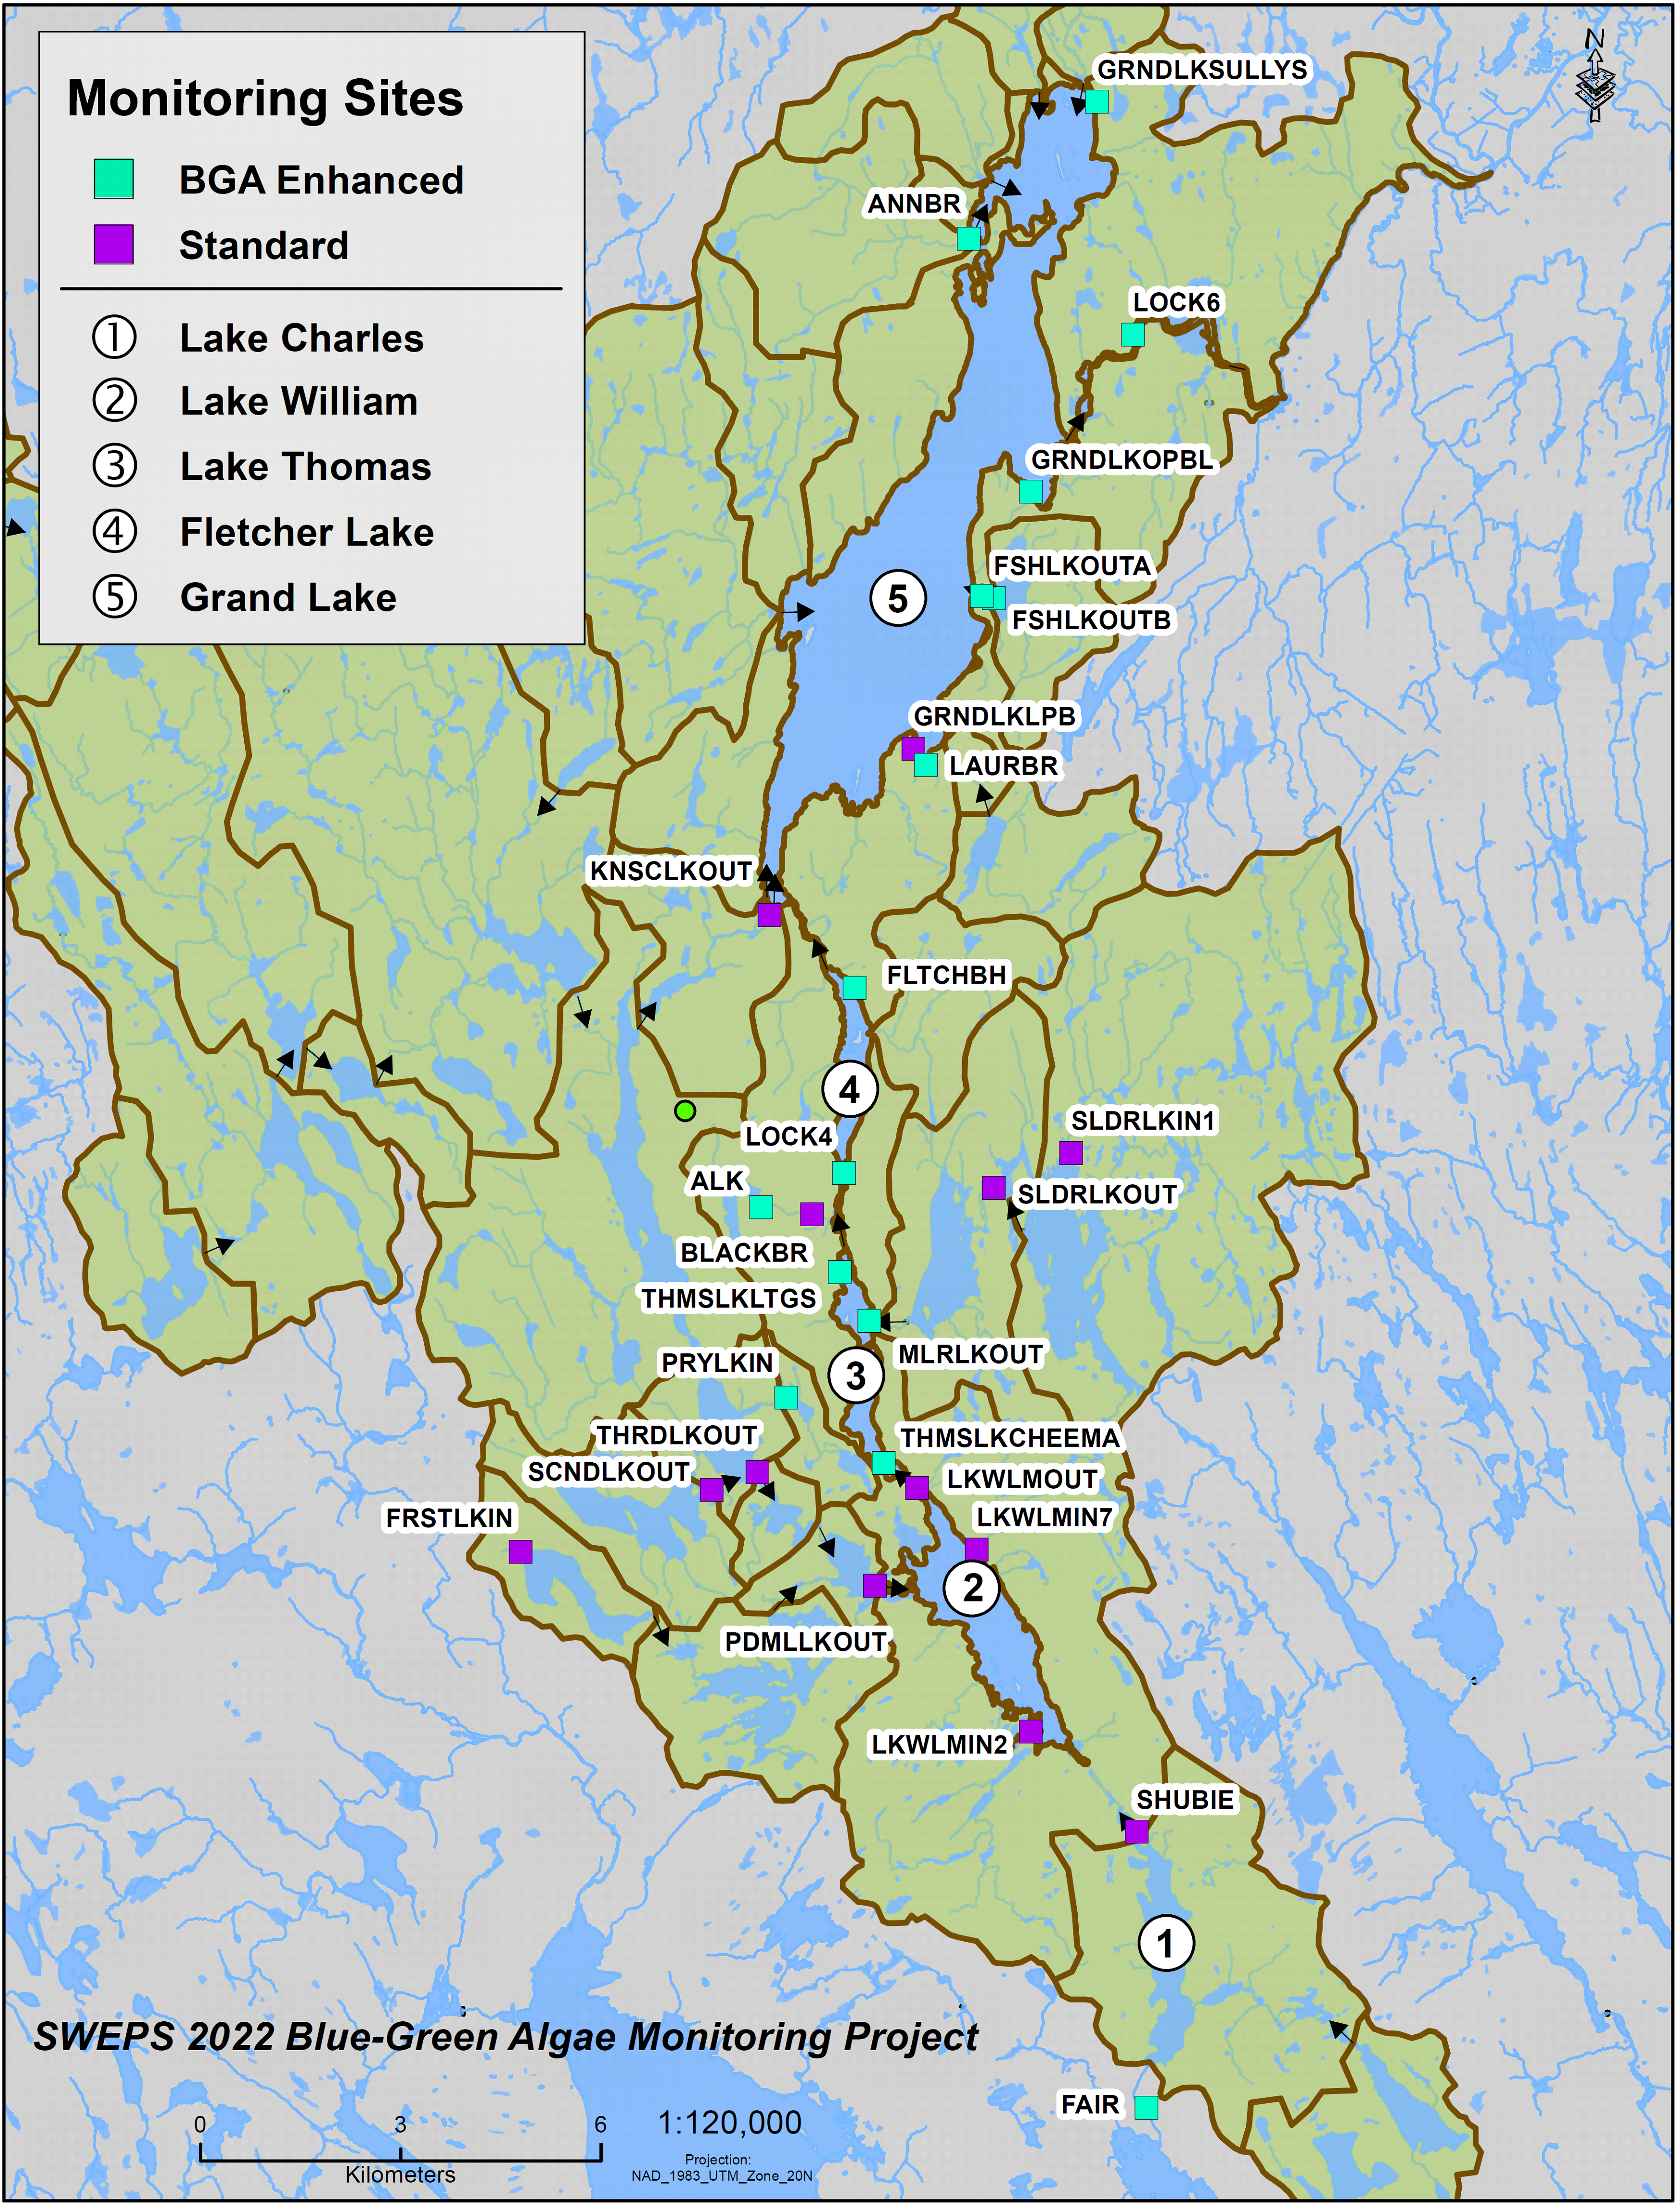
The project was implemented in the late spring of 2021, and so, includes data from the past two field seasons, 2021 and 2022. SWEPS water quality monitoring program consists of 27 water sampling locations and are broken out into two broad categories, standard and enhanced (fig 1, table 1). The enhanced blue-green algae (BGA) test sites, 14 locations, have additional chemical analyses, specifically phosphorus and nitrogen tests. Ideally, these sites are tested at least 3 times in each field season and include small brooks, lake shores, etc. and can have a wide range of values, so it is important to note the site conditions when analyzing. Water quality parameters can have a wide range of values so it is important to note weather conditions at the time of sampling and note the quality of riparian zones, urban development, and chemical runoff.
BGA parameters, also measured by HRM, Municipality of East Hants, Halifax Water, Dalhousie University, and SWEPS historical data can show where high nutrient locations, how these are changing, and potential causes for changes. The main questions SWEPS wanted to know were: Are there any areas of concern that show up in the parameters on the map? And do any of these site parameters change over time, indicating problem areas?
Summary of BGA testing locations for 2021 and 2022:
There were a total of 114 water samples taken at these BGA test site locations in the 2021 and 2022 field seasons with 40 samples taken in 2021 and 74 samples in 2022. There were 69 standard samples taken in the 2021 and 2022 field season with 39 samples taken in 2021 and 30 in samples in 2022. The final water sample total is 183.

Figure 1. SWEPS testing location
| Area | Site ID | Description | Category | Sample Count | Latitude | Longitude |
| A Lake | ALK | St. Andrews Park | Enhanced | 8 | 44.8231 | -63.6289 |
| Annand Brook | ANNBR | Inlet to Little Grand Lake | Enhanced | 8 | 44.95374 | -63.5908 |
| Black’s Brook | BLACKBR | A Lake outlet – Near Lockview HS | Standard | 6 | 44.82221 | -63.6192 |
| First Lake | FRSTLKIN | First Lake – Inlet by bridge | Standard | 9 | 44.77642 | -63.6738 |
| Fish Lake | FSHLKOUTA | Fish Lake Outlet | Enhanced | 10 | 44.90537 | -63.5856 |
| Fish Lake | FSHLKOUTB | Stream btw Fish Lk and Grand Lk | Enhanced | 4 | 44.90565 | -63.5878 |
| Fletcher Lake | FLTCHBH | Dock (4175 NS Trunk 2) | Enhanced | 6 | 44.85275 | -63.6114 |
| Grand Lake | GRNDLKLPB | Laurie Park beach | Standard | 5 | 44.88504 | -63.6006 |
| Grand Lake | GRNDLKOPBL | Oakfield Park Boat Launch | Enhanced | 8 | 44.91969 | -63.5787 |
| Grand Lake | GRNDLKSULLYS | Sully’s Campground Beach | Enhanced | 8 | 44.97228 | -63.5666 |
| Kinsac Lake | KNSCLKOUT | Rawdon River – Kinsac Lake outlet | Standard | 5 | 44.8625 | -63.6276 |
| Lake Thomas | THMSLKCHEEMA | CHEEMA dock | Enhanced | 6 | 44.78877 | -63.6052 |
| Lake Thomas | THMSLKLTGS | Gordon Snow Comm Cntr dock | Enhanced | 8 | 44.81447 | -63.6138 |
| Lake William | LKWLMIN2 | Marshall Brook – Inlet to LK William | Standard | 5 | 44.75274 | -63.577 |
| Lake William | LKWLMIN7 | Skerry Brook – Inlet to LK William | Standard | 7 | 44.77725 | -63.5875 |
| Lake William | LKWLMOUT | Waverley Park Dock | Standard | 15 | 44.78549 | -63.5989 |
| Laurie Brook | LAURBR | Laurie Prov. Park – Inlet to Grand LK | Enhanced | 3 | 44.88283 | -63.5983 |
| Lock 4 | LOCK4 | Lock 4 | Enhanced | 1 | 44.82781 | -63.6132 |
| Miller Lake | MLRLKOUT | Outlet – Inn on the Lake parking lot | Enhanced | 8 | 44.80794 | -63.6081 |
| Perry Lake | PRYLKIN | Trail off the small walking bridge | Enhanced | 6 | 44.79751 | -63.6238 |
| Powder Mill Lake | PDMLLKOUT | Powder Mill Lake – Outlet by park | Standard | 7 | 44.77228 | -63.6067 |
| Second Lake | SCNDLKOUT | Second Lake outlet – off train tracks | Standard | 5 | 44.78499 | -63.6377 |
| Shubenacadie Canal | FAIR | Fairbanks centre off dock | Enhanced | 3 | 44.7022 | -63.5546 |
| Shubenacadie Canal | SHUBIE | Shubie Trail Head – near trail bridge | Standard | 4 | 44.73939 | -63.5569 |
| Shubenacadie River | LOCK6 | Lock 6 | Enhanced | 9 | 44.94099 | -63.5595 |
| Soldier Lake | SLDRLKIN1 | Soldier Lake Inlet – Preeper Brook | Standard | 10 | 44.83076 | -63.5701 |
| Soldier Lake | SLDRLKOUT | Soldier LK outlet-Top of Tillman BR | Standard | 16 | 44.82592 | -63.5848 |
| Third Lake | THRDLKOUT | Off Winley Dr Trail – Third LK Outlet | Standard | 8 | 44.78737 | -63.6292 |
Table 1. SWEPS testing locations
After discussing with Rob Jamieson’s lab and the AGAT lab, where the professional samples are taken, it was determined that for BGA testing, SWEPS needed to test for Total Phosphate and Total Kjeldahl Nitrogen (TKN). Dr. Tri Nguyen-Quang from Dalhousie also suggested both phosphorus and nitrogen. For the form of nitrogen, TKN, in particular, this form is needed due to the bioavailability of this form of nitrogen for aquatic life such as plants and algae. Although SWEPS data points for phosphorus and nitrogen are few, there is an AECOM report from 2012 with the average and standard deviation values for phosphorus. This report also had N:P ratios, but it appeared this was total nitrogen and not total Kjeldahl nitrogen, so these nitrogen values cannot be compared. The Municipality of East Hants provided a spreadsheet of their data from 2009 to 2019 with phosphorus, TKN, and other variables. This allowed some spatial and temporal analysis of these variables.
Known BGA Locations
Blue-green algae has been found in many of the lakes within the watershed, particularly in those areas where human activities are most prevalent.

Figure 2. Some reported BGA locations from 2021
Temporal Distributions of SWEPS Data
SWEPS data collection is done mostly during the summer, shown in the Figure 3 distribution, with the summer co-op students, but some testing is done in the off season. There was a large spike in testing around the 70s and 90s, shown in Figure 4, which could affect spatial visualization, since there were only a couple of sites being tested and there may be changes over time. You can see the few sites that had numerous tests in that time period in Figure 5, which could also affect the data visualization. Testing has been increasing in the past 10 years as well as the number and spatial distribution of sites, which is highly beneficial for analysis, but to the limit of the past 10 years.

Figure 3. Distribution of SWEPS testing points over the months

Figure 4. Distribution of SWEPS data over the years

Figure 5. This shows the distribution of samples at different locations
When analyzing SWEPS data these temporal distributions of data points must be taken into consideration, because there are seasonal, spatial, and possibly yearly changes in some parameters. For instance, if one site has only been measured in the off season and other sites were only measured in the summer, this will have a great impact on spatial distribution variables and the trends over time. Seasonally changing parameters included dissolved oxygen, temperature, and salinity, shown below in Figures 6 to 8. No other SWEPS variables showed monthly trends. Additionally, TKE appears to drop in the fall and Phosphorus spikes in September. These changes could be because of changes in sunlight, ambient temperature, evaporation, and rain frequency and intensity.

Figure 6. Dissolved Oxygen levels changing over the months
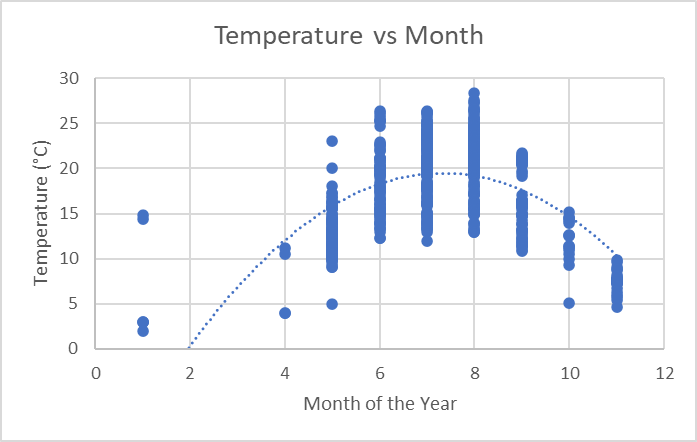
Figure 7. Water temperature changing over the months
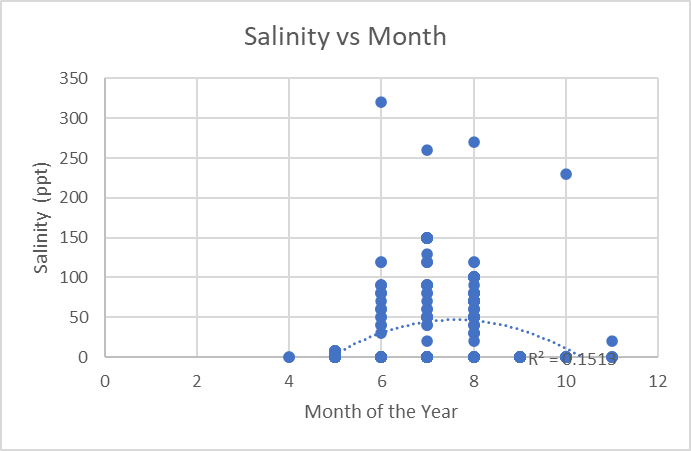
Figure 8. Salinity levels changing over the months

Figure 9. TKE levels over the months, averaged from 2009 to 2019

Figure 10. Total Phosphorus levels over the months, averaged from 2009 to 2019
Some parameters without seasonal changes that have been rising over time are turbidity, conductivity, and pH in Figures 11 to 13. This could be due to climate change, urban development, increased chemical runoff, or ecosystem recovery. Cam (SWEPS volunteer from BIO) has suggested that pH is rising due to the lack of acid rain as that environmental issue is being solved (Monica Forestell). Statistics would need to be done to properly determine the significance of different factors on different parameters.
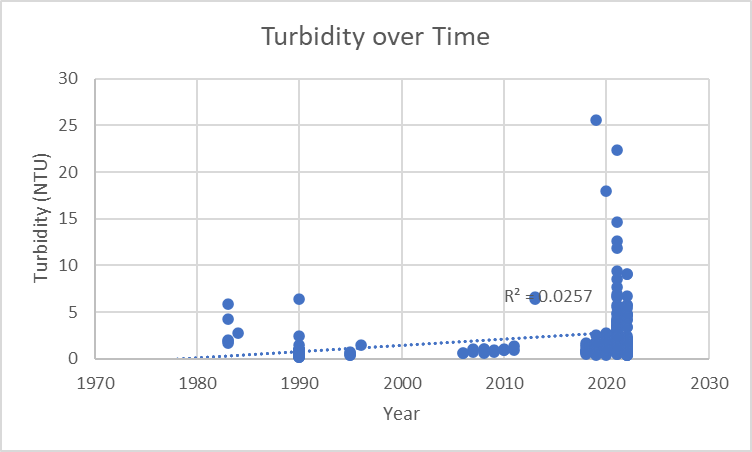
Figure 11. Turbidity increasing since the 1980s
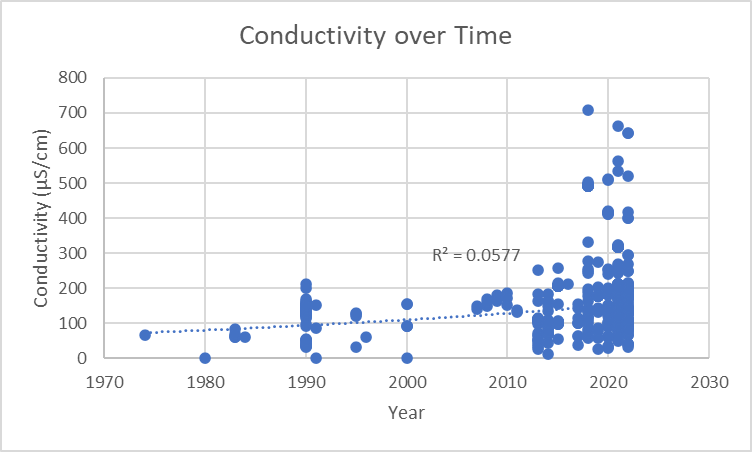
Figure 12. Conductivity increasing since the 1980s

Figure 13. pH increasing since the 1980s
The AECOM report data only shows the average and standard deviation from 2002-2011 of the lakes they tested. This data can be used in the spatial analysis but is not included in Figure 14. This figure shows phosphorus decreasing over time in the East Hants data from 5 locations in the Shubenacadie watershed. This may mean phosphorus levels are decreasing across the watershed, but this does not test specific areas of concern, apart from SWPP5, where BGA was encountered by SWEPS employees in July 2022. In Figure 15, TKN did not seem to have the same trend. This parameter rose and fell around 2012 with a couple of spikes around 2016. The SWEPS data from 2022 with the East Hants and AECOM data may show a trend when the SWEPS data is implemented.

Figure 14. Temporal change of phosphorus at 5 locations in the watershed, from East Hants values
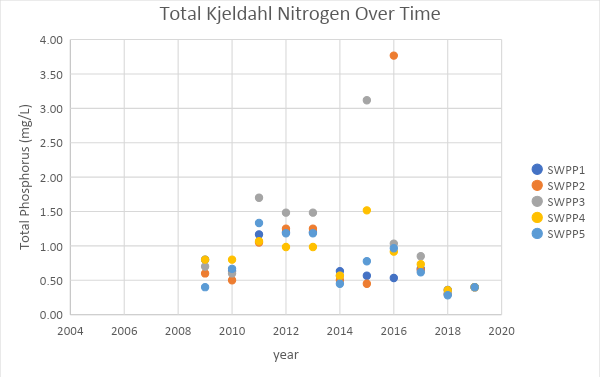
Figure 15. Temporal change of TKN at 5 locations in the watershed, from East Hants values
Spatial Distributions of SWEPS Data
The non-seasonally changing parameters are more easily interpreted on maps, so turbidity, pH, TDS, and specific conductivity, and phosphorus were mapped (Figures 16 to 19). Specific conductivity, turbidity, pH, and TDS, all are highest in Downtown Dartmouth and Bennery Brook. For specific conductivity and TDS, this is more toward the Shubenacadie River end of Bennery Brook. There are a few outliers in this data, including the specific conductivity and TDS as First Lake, which have elevated levels. Turbidity and pH also have elevated levels around Miller Lake. The data in these areas should be investigated to see if there is any change over time. It’s also important to note how many data points were taken at any outlier sites and when these points were taken. The readings from the airport culvert under the highway were very high, as seen in field observations and may not have been in the data, which should be investigated. First Lake’s very high readings for one data point in field observations was likely from the loads of cut grass and plant debris that has washed up on shore after a big rain. This data point could possibly be taken out of the maps to avoid skewed results.

Figure 16. Distribution of SWEPS specific conductivity data
| Location | Lat | Long | Conduct uS/cm Avg | Conduct uS/cm Count | Conduct uS/cm Min | Conduct uS/cm Max | Conduct uS/cm St Dev | Year Min | Year Max |
| A Lake | 44.823100 | -63.628875 | 105.13 | 7 | 78.5 | 115.8 | 12.5323 | 2021 | 2022 |
| Annand Brook | 44.953745 | -63.590749 | 54.74 | 8 | 26.4 | 94.0 | 20.8334 | 2018 | 2022 |
| Bennery Brook | 44.927000 | -63.535660 | 265.65 | 102 | 40.3 | 510.6 | 128.7673 | 2018 | 2022 |
| Black’s Brook | 44.822208 | -63.619153 | 107.63 | 6 | 97.8 | 112.5 | 5.3061 | 2021 | 2022 |
| Charles Lake | 44.736123 | -63.555177 | 255.11 | 7 | 178.0 | 294.8 | 36.8455 | 2018 | 2022 |
| First Lake | 44.776367 | -63.673624 | 553.16 | 7 | 242.2 | 707.0 | 154.0641 | 2018 | 2022 |
| Fish Lake | 44.905371 | -63.585561 | 97.80 | 7 | 93.0 | 102.6 | 3.4054 | 2021 | 2022 |
| Fletcher Lake | 44.841469 | -63.612036 | 143.73 | 140 | 32.0 | 256.0 | 44.7626 | 1990 | 2022 |
| Grand Lake | 44.909608 | -63.602937 | 107.84 | 17 | 83.6 | 129.8 | 8.6703 | 2021 | 2022 |
| Holland Brook | 44.847397 | -63.603783 | 82.57 | 24 | 25.0 | 164.1 | 45.4468 | 2013 | 2017 |
| Kinsac Lake | 44.828792 | -63.654292 | 97.60 | 8 | 64.9 | 203.5 | 45.4570 | 2018 | 2022 |
| Lake Loon | 44.711137 | -63.515620 | 260.10 | 2 | 189.4 | 330.8 | 99.9849 | 2018 | 2018 |
| Lake Thomas | 44.801883 | -63.608091 | 187.31 | 15 | 166.9 | 213.7 | 12.9665 | 2021 | 2022 |
| Lake William | 44.773180 | -63.590181 | 146.06 | 45 | 29.5 | 254.1 | 61.9513 | 2018 | 2022 |
| Laurie Brook | 44.882825 | -63.598258 | 105.05 | 2 | 85.0 | 125.1 | 28.3550 | 2021 | 2022 |
| Miller Lake | 44.816152 | -63.592737 | 104.88 | 17 | 64.5 | 252.9 | 43.6876 | 1974 | 2020 |
| Miller lake outlet | 44.807936 | -63.608131 | 134.07 | 7 | 124.6 | 149.4 | 9.5730 | 2021 | 2022 |
| Perry Lake | 44.797508 | -63.623780 | 142.08 | 5 | 124.1 | 190.1 | 27.2889 | 2021 | 2022 |
| Powder Mill Lake | 44.772213 | -63.606776 | 236.70 | 7 | 141.0 | 267.5 | 42.8357 | 2018 | 2022 |
| Second Lake | 44.784982 | -63.637725 | 150.39 | 6 | 134.3 | 168.3 | 11.0480 | 2019 | 2022 |
| Lake William Outlet | 44.785510 | -63.598820 | 216.88 | 12 | 173.4 | 417.8 | 89.8688 | 2021 | 2022 |
| Lock Six | 44.940907 | -63.559285 | 107.77 | 7 | 103.1 | 113.5 | 4.1230 | 2021 | 2022 |
| Soldier Lake | 44.820965 | -63.572742 | 109.38 | 54 | 12.9 | 190.9 | 37.5518 | 1983 | 2022 |
| Third Lake | 44.787061 | -63.629808 | 125.70 | 8 | 82.8 | 143.2 | 19.1177 | 2018 | 2022 |
| Tillmann’s Brook | 44.825227 | -63.587153 | 100.18 | 31 | 55.9 | 105.7 | 8.6002 | 2014 | 2017 |
Table 2 – 552 Samples with Specific Conductivity grouped and averaged at 25 locations within the watershed.

Figure 17. Distribution of SWEPS turbidity data
| Location | Lat | Long | Turbidity ntu Avg | Turbidity ntu Count | Turbidity ntu Min | Turbidity ntu Max | Turbidity ntu St Dev | Year Min | Year Max |
| A Lake | 44.823100 | -63.628875 | 2.6950 | 7 | 0.980 | 9.360 | 2.9700 | 2021 | 2022 |
| Annand Brook | 44.953745 | -63.590749 | 4.2656 | 9 | 0.590 | 25.600 | 8.0807 | 2018 | 2022 |
| Bennery Brook | 44.927000 | -63.535660 | 3.7822 | 82 | 1.100 | 65.200 | 8.8134 | 2019 | 2022 |
| Black’s Brook | 44.822208 | -63.619153 | 3.2667 | 6 | 0.700 | 11.850 | 4.2671 | 2021 | 2022 |
| Charles Lake | 44.736123 | -63.555177 | 5.7800 | 4 | 0.980 | 12.600 | 5.4466 | 2021 | 2022 |
| First Lake | 44.776367 | -63.673624 | 7.9092 | 6 | 1.640 | 22.400 | 7.3692 | 2018 | 2022 |
| Fish Lake | 44.905371 | -63.585561 | 1.7821 | 7 | 0.940 | 4.070 | 1.0890 | 2021 | 2022 |
| Fletcher Lake | 44.841469 | -63.612036 | 0.6978 | 118 | 0.210 | 6.400 | 0.6732 | 1990 | 2022 |
| Grand Lake | 44.909608 | -63.602937 | 2.1432 | 17 | 0.620 | 4.850 | 1.2198 | 2021 | 2022 |
| Kinsac Lake | 44.828792 | -63.654292 | 1.4129 | 7 | 0.710 | 2.190 | 0.4569 | 2018 | 2022 |
| Lake Thomas | 44.801883 | -63.608091 | 1.3954 | 13 | 0.400 | 4.405 | 1.0088 | 2021 | 2022 |
| Lake William | 44.773180 | -63.590181 | 1.6122 | 16 | 0.490 | 5.510 | 1.5825 | 2018 | 2022 |
| Laurie Brook | 44.882825 | -63.598258 | 4.9775 | 2 | 4.220 | 5.735 | 1.0713 | 2021 | 2022 |
| Miller Lake | 44.816152 | -63.592737 | 1.7092 | 6 | 0.630 | 4.300 | 1.3841 | 1983 | 2020 |
| Miller lake outlet | 44.807936 | -63.608131 | 1.1071 | 7 | 0.645 | 1.820 | 0.4061 | 2021 | 2022 |
| Perry Lake | 44.797508 | -63.623780 | 8.0870 | 5 | 1.540 | 14.600 | 4.7046 | 2021 | 2022 |
| Powder Mill Lake | 44.772213 | -63.606776 | 0.9267 | 6 | 0.520 | 1.400 | 0.3228 | 2018 | 2022 |
| Second Lake | 44.784982 | -63.637725 | 1.4025 | 6 | 0.745 | 2.255 | 0.6446 | 2019 | 2022 |
| Lake William Outlet | 44.785510 | -63.598820 | 1.6192 | 12 | 0.520 | 4.850 | 1.1277 | 2021 | 2022 |
| Lock Six | 44.940907 | -63.559285 | 2.0158 | 6 | 0.550 | 4.110 | 1.3520 | 2021 | 2022 |
| Soldier Lake | 44.820965 | -63.572742 | 2.1836 | 22 | 0.440 | 6.640 | 1.9554 | 1983 | 2022 |
| Third Lake | 44.787061 | -63.629808 | 1.1021 | 7 | 0.380 | 2.225 | 0.7551 | 2018 | 2022 |
Table 3 – 372 Samples with turbidity grouped and averaged at 22 locations within the watershed.

Figure 18. Distribution of SWEPS pH data
| Location | Lat | Long | PH Avg | PH Count | PH Min | PH Max | PH Std Dev | Year Min | Year Max |
| A Lake | 44.823100 | -63.628875 | 6.81 | 7 | 6.38 | 7.08 | 0.2331 | 2021 | 2022 |
| Annand Brook | 44.953745 | -63.590749 | 6.65 | 9 | 5.70 | 7.13 | 0.4944 | 2018 | 2022 |
| Bennery Brook | 44.927000 | -63.535660 | 6.97 | 103 | 5.53 | 9.93 | 0.4333 | 2018 | 2022 |
| Black’s Brook | 44.822208 | -63.619153 | 6.97 | 6 | 6.51 | 7.35 | 0.3079 | 2021 | 2022 |
| Charles Lake | 44.736123 | -63.555177 | 7.42 | 7 | 7.08 | 7.93 | 0.3433 | 2018 | 2022 |
| First Lake | 44.776367 | -63.673624 | 7.53 | 7 | 7.34 | 8.00 | 0.2351 | 2018 | 2022 |
| Fish Lake | 44.905371 | -63.585561 | 6.99 | 7 | 6.61 | 7.42 | 0.3231 | 2021 | 2022 |
| Fletcher Lake | 44.841469 | -63.612036 | 6.73 | 145 | 4.50 | 7.75 | 0.3881 | 1990 | 2022 |
| Grand Lake | 44.909608 | -63.602937 | 7.16 | 62 | 6.41 | 7.66 | 0.2647 | 2009 | 2022 |
| Holland Brook | 44.847397 | -63.603783 | 6.58 | 24 | 5.68 | 7.32 | 0.4182 | 2013 | 2017 |
| Kinsac Lake | 44.828792 | -63.654292 | 7.07 | 8 | 6.40 | 7.78 | 0.4187 | 2018 | 2022 |
| Lake Loon | 44.711137 | -63.515620 | 7.19 | 2 | 6.95 | 7.42 | 0.3323 | 2018 | 2018 |
| Lake Thomas | 44.801883 | -63.608091 | 7.19 | 15 | 6.70 | 7.95 | 0.3736 | 2021 | 2022 |
| Fletcher Lake Outlet | 44.856700 | -63.617350 | 7.13 | 44 | 6.00 | 7.50 | 0.2880 | 2009 | 2017 |
| Lake William | 44.773180 | -63.590181 | 6.79 | 45 | 5.14 | 8.16 | 0.6726 | 2018 | 2022 |
| Laurie Brook | 44.882825 | -63.598258 | 6.59 | 2 | 6.27 | 6.90 | 0.4455 | 2021 | 2022 |
| Miller Lake | 44.816152 | -63.592737 | 6.10 | 19 | 4.50 | 7.50 | 0.9768 | 1974 | 2020 |
| Miller lake outlet | 44.807936 | -63.608131 | 7.00 | 7 | 6.60 | 7.49 | 0.3714 | 2021 | 2022 |
| Perry Lake | 44.797508 | -63.623780 | 7.18 | 5 | 6.68 | 7.63 | 0.3614 | 2021 | 2022 |
| Powder Mill Lake | 44.772213 | -63.606776 | 7.74 | 7 | 7.24 | 8.08 | 0.2805 | 2018 | 2022 |
| Second Lake | 44.784982 | -63.637725 | 7.27 | 6 | 7.18 | 7.46 | 0.1038 | 2019 | 2022 |
| Lake William Outlet | 44.785510 | -63.598820 | 7.23 | 12 | 6.84 | 7.49 | 0.2211 | 2021 | 2022 |
| Lock Six | 44.940907 | -63.559285 | 6.74 | 9 | 6.02 | 7.28 | 0.3796 | 2021 | 2022 |
| Soldier Lake | 44.820965 | -63.572742 | 6.40 | 56 | 4.17 | 7.88 | 0.7451 | 1983 | 2022 |
| Third Lake | 44.787061 | -63.629808 | 7.56 | 8 | 7.04 | 7.92 | 0.3084 | 2018 | 2022 |
| Tillmann’s Brook | 44.825227 | -63.587153 | 6.58 | 31 | 6.10 | 6.90 | 0.1685 | 2014 | 2017 |
Table 4 – 655 Samples with PH grouped and averaged at 26 locations within the watershed.

Figure 19. Distribution of SWEPS TDS data
| Location | Lat | Long | TDS ppm Avg | TDS ppm Count | TDS ppm Min | TDS ppm Max | TDS ppm St Dev | Year Min | Year Max |
| A Lake | 44.823100 | -63.628875 | 68.25 | 7 | 51.00 | 75.40 | 8.1397 | 2021 | 2022 |
| Annand Brook | 44.953745 | -63.590749 | 28.19 | 8 | 13.00 | 43.55 | 10.7871 | 2018 | 2022 |
| Bennery Brook | 44.927000 | -63.535660 | 177.77 | 103 | 26.20 | 336.70 | 88.7197 | 2018 | 2022 |
| Black’s Brook | 44.822208 | -63.619153 | 70.07 | 6 | 63.50 | 73.45 | 3.5502 | 2021 | 2022 |
| Charles Lake | 44.736123 | -63.555177 | 172.47 | 6 | 157.30 | 191.75 | 12.0884 | 2018 | 2022 |
| First Lake | 44.776367 | -63.673624 | 361.48 | 6 | 236.60 | 461.50 | 76.7326 | 2018 | 2022 |
| Fish Lake | 44.905371 | -63.585561 | 64.04 | 7 | 61.75 | 66.70 | 1.8082 | 2021 | 2022 |
| Fletcher Lake | 44.841469 | -63.612036 | 115.32 | 6 | 110.50 | 118.30 | 2.6368 | 2021 | 2022 |
| Grand Lake | 44.909608 | -63.602937 | 67.54 | 17 | 13.00 | 84.50 | 14.5901 | 2021 | 2022 |
| Kinsac Lake | 44.828792 | -63.654292 | 71.09 | 7 | 48.50 | 151.45 | 36.9342 | 2018 | 2022 |
| Lake Loon | 44.711137 | -63.515620 | 194.03 | 2 | 172.90 | 215.15 | 29.8753 | 2018 | 2018 |
| Lake Thomas | 44.801883 | -63.608091 | 120.61 | 15 | 108.55 | 141.00 | 9.1208 | 2021 | 2022 |
| Lake William | 44.773180 | -63.590181 | 99.65 | 16 | 39.00 | 137.10 | 36.6582 | 2018 | 2022 |
| Laurie Brook | 44.882825 | -63.598258 | 68.23 | 2 | 55.25 | 81.20 | 18.3494 | 2021 | 2022 |
| Miller Lake | 44.816152 | -63.592737 | 83.94 | 5 | 70.85 | 100.10 | 12.7727 | 2018 | 2020 |
| Miller lake outlet | 44.807936 | -63.608131 | 87.62 | 6 | 80.00 | 96.85 | 6.6872 | 2021 | 2022 |
| Perry Lake | 44.797508 | -63.623780 | 91.24 | 5 | 80.50 | 121.55 | 17.3511 | 2021 | 2022 |
| Powder Mill Lake | 44.772213 | -63.606776 | 162.65 | 6 | 150.15 | 173.80 | 7.7123 | 2018 | 2022 |
| Second Lake | 44.784982 | -63.637725 | 100.61 | 4 | 95.55 | 109.20 | 6.0341 | 2021 | 2022 |
| Lake William Outlet | 44.785510 | -63.598820 | 141.07 | 12 | 112.45 | 273.00 | 58.7134 | 2021 | 2022 |
| Lock Six | 44.940907 | -63.559285 | 70.56 | 7 | 67.60 | 74.10 | 2.3430 | 2021 | 2022 |
| Soldier Lake | 44.820965 | -63.572742 | 87.88 | 19 | 63.70 | 152.10 | 24.1530 | 2018 | 2022 |
| Third Lake | 44.787061 | -63.629808 | 86.57 | 6 | 76.70 | 93.00 | 5.5487 | 2018 | 2022 |
Table 5 – 280 Samples with TDS grouped and averaged at 23 locations within the watershed.
Total phosphorus had some very high nutrient locations from the AECOM report and East Hants data. In particular, the largest value, located on the West side of the map in Figure 20, was from a previous sewage plant, and this lake is now considered dead (Tom Mills). Other high phosphorus areas could have been results from effluent, farms, or possibly septic tanks. The average TKN values from the 5 East Hants sites, were all very close to 1 mg/L, so they did not have much variation and would not show any noticeable variation if mapped.

Figure 20. Distribution of phosphorus data from AECOM report and East Hants spreadsheet
LIDAR Data
Knowing the extent of the watershed and seeing the LIDAR imaging of the watershed may help with future characterization and analysis. Cam has suggested stitching the HRM LIDAR data seen below in Figure 21 to the East Hants LIDAR data to complete the pictures, since the top of Grand Lake is missing from this data. This could be a task for future students.

Figure 21. LIDAR imaging with SWEPS test sites
Summary and Recommendations
There are very evident patterns in the temporal and spatial visualizations of the SWEPS data, though it is important to note the quality of the data, such as how many data points were taken and what the years of those points were. These concerns could be tackled by future students. The readings from the airport culvert under the highway were very high when observed in the field and may not have been in the data, which should be investigated. First Lake also had very high readings for one data point, which, in field observations, was likely from the loads of cut grass and plant debris that has washed up on shore after a big rain. This is an outlier that may need discussion if it needs to be taken out of the map data. This data is full of trends that may interest students, the SWEPS committee, and other parties. This report can be used as a starting point for a more in-depth analysis of the watershed. All materials used can be found in the 2022 SWEPS files.
As for predicting blue-green algae blooms, it would be very difficult to predict blooms since blooms were reported across the watershed and SWEPS does not have the specific locations, especially for larger lakes. Regardless, this information can still be used for the Bennery Brook project and focusing on restoration for other areas as well, and can still identify “problem” areas.
The following are suggestions for future students to continue work on this data:
- Implement the 2022 phosphorus and nitrogen SWEPS data from AGAT
- For a more detailed map, more specific coordinates can be found for each site, so sites won’t be grouped and averaged into one value and the proper location can be displayed
- Investigate the data of the elevated parameter areas to see if there is any change over time.
- Investigate outliers for the number of data points and dates of data points
- Investigate airport culvert readings
- Discuss if First Lake reading should be taken out of map data
- Stitch East Hants and HRM LIDAR